
That is a way of entering a room full of traders: "Do not use indicators". One thing's for sure: discussion. As i promised to give back Pandora's box to traders who find it hard to win substantially, this is lesson 4: do not use indicators!
I have nothing against these things, in fact i use one myself (MACD), but when learning how to trade with profit, they sort of blind you with promises they never keep. Like a second hand car salesman: you know he's going to screw you, and still you buy that car.
 The salesmen who try to sell you superduper strategies with homebrew indicators, show you the many wins you would make with these things. Watching their videos, it often seems very persuasive. However in practice these indicator-based strategies never work.
Break it down
Let's break this down. Indicators calculate what has been in the past. Now we all know that the past will never repeat itself. A moving average or Bollinger Bands can show a beautiful price curve, but price kan break out and will not listen to that curve. So the moving average is always right, unless it is wrong...
Why do many traders use them? Even experienced traders? Because they can confirm or deny what we see in the charts. So they help a trader in his fight with greed and fear. Another reason to use them is legit: indicators make calculations faster than you or me. And that is why sometimes i use the MACD.
Experienced traders will confirm this: they would probably make just as much money with as without their beloved indicators.
Something to cling to
As beginner or amature trader you are in desperate need of support. You want all sorts of tools to help you see what is going on and where price will go. There are three better options than indicators that will help you better:
 Do remember: the floor traders who trade with milions of dollars and euro's only use numbers. Many of them do not even have charts.
We will trust on charts, but later on you will see that even the good-old candle sticks will make place for better tools.
Tools that only jForex offers for free. Dukascopy: thank you for that.
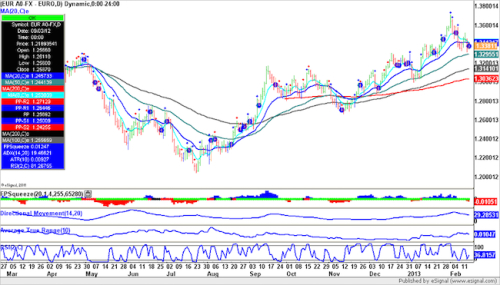
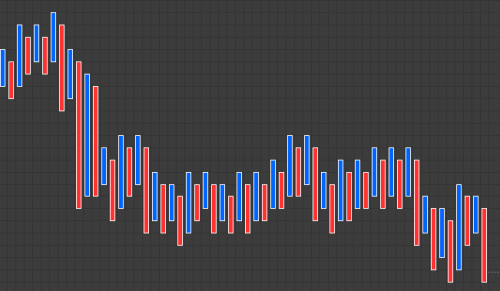
Now to end this story: what chart gives more confidence: the first one, cluttered up with nifty indicators, or the chart you see here?
Make a guess: where will price go after the last red candle? And in the upper picture? The right answers will be rewarded with as many Likes as ik can give.
I have nothing against these things, in fact i use one myself (MACD), but when learning how to trade with profit, they sort of blind you with promises they never keep. Like a second hand car salesman: you know he's going to screw you, and still you buy that car.
 The salesmen who try to sell you superduper strategies with homebrew indicators, show you the many wins you would make with these things. Watching their videos, it often seems very persuasive. However in practice these indicator-based strategies never work.
Break it down
Let's break this down. Indicators calculate what has been in the past. Now we all know that the past will never repeat itself. A moving average or Bollinger Bands can show a beautiful price curve, but price kan break out and will not listen to that curve. So the moving average is always right, unless it is wrong...
Why do many traders use them? Even experienced traders? Because they can confirm or deny what we see in the charts. So they help a trader in his fight with greed and fear. Another reason to use them is legit: indicators make calculations faster than you or me. And that is why sometimes i use the MACD.
Experienced traders will confirm this: they would probably make just as much money with as without their beloved indicators.
Something to cling to
As beginner or amature trader you are in desperate need of support. You want all sorts of tools to help you see what is going on and where price will go. There are three better options than indicators that will help you better:
- If working with a timeframe of (for example) 15m, you might want to see the hour candle and even the day candle in the same chart. Bigger timeframes give you more perspective on trend than any indicator.
- Drawing horizontal support and resistance lines can help a lot. They show you the possible price limits they might bounce on or break through. Also the daily pivot gives you this support. Same counts for the daily open line and the London Session open line. Finally draw lines at the round numbers in the charts. Like 18.00 and 18.10 in XAGUSD.
- Draw diagonal lines (see: How to learn trading) to start recognizing channels or draw equidistant channels – Channel lines in jForex. These lines are no Support or Resistance lines! They do not support the price. They however do show you the natural pulsation of price.
 Do remember: the floor traders who trade with milions of dollars and euro's only use numbers. Many of them do not even have charts.
 We will trust on charts, but later on you will see that even the good-old candle sticks will make place for better tools.
Tools that only jForex offers for free. Dukascopy: thank you for that.
Now to end this story: what chart gives more confidence: the first one, cluttered up with nifty indicators, or the chart you see here?
Make a guess: where will price go after the last red candle? And in the upper picture? The right answers will be rewarded with as many Likes as ik can give.