
Since I've just posted a trade idea on the EURCAD, I figured I might as well post my EURUSD chart as well.
Keep in mind, with Elliott Wave analysis, things can change very fast and a count can easily be invalidated. For now, this is the view that I like.
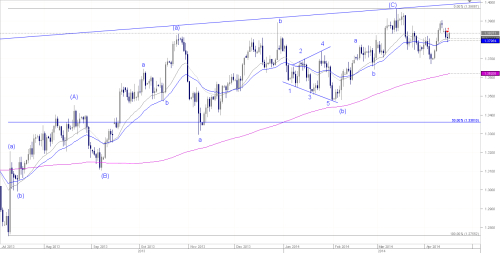
The Daily chart below shows an ABC structure that started at 1.2755 and I am showing it as completed at 1.3966. The second part of the structure, Wave (C) shows the internal structure quite clearly with a running flat (b) wave. What's interesting is the 5 waves coming out of the flat structure on the chart is taking the structure of an expanding diagonal which is a very rare pattern. Because of that I'm sure not many would label their chart in this manner.
The invalidation point for this count is above the (C) high at 1.3966. An aggressive trader may try stops above the recent peak at 1.3900 but if we see an expanded flat that high can be taken out, meaning initially a stop can be place over 1.3900 but if we see a strong bounce at the recent lows at 1.3670 and the price bounces back, stops would have to be moved above 1.3966.
The target I have is the 50% retracement which comes in at 1.3360
At current levels, that is a 120 pip stop versus a 485 pip gain, Giving it a 1:4 Risk to Reward.
On a side note, this trade idea is directly related to the GBP/USD doing a flat on the daily chart which I previously blogged about. If the GBP makes new highs, it invalidates this trade setup as well.
Keep in mind, with Elliott Wave analysis, things can change very fast and a count can easily be invalidated. For now, this is the view that I like.
The Daily chart below shows an ABC structure that started at 1.2755 and I am showing it as completed at 1.3966. The second part of the structure, Wave (C) shows the internal structure quite clearly with a running flat (b) wave. What's interesting is the 5 waves coming out of the flat structure on the chart is taking the structure of an expanding diagonal which is a very rare pattern. Because of that I'm sure not many would label their chart in this manner.
The invalidation point for this count is above the (C) high at 1.3966. An aggressive trader may try stops above the recent peak at 1.3900 but if we see an expanded flat that high can be taken out, meaning initially a stop can be place over 1.3900 but if we see a strong bounce at the recent lows at 1.3670 and the price bounces back, stops would have to be moved above 1.3966.
The target I have is the 50% retracement which comes in at 1.3360
At current levels, that is a 120 pip stop versus a 485 pip gain, Giving it a 1:4 Risk to Reward.

On a side note, this trade idea is directly related to the GBP/USD doing a flat on the daily chart which I previously blogged about. If the GBP makes new highs, it invalidates this trade setup as well.