I don't know how many of you are aware the GBPUSD is on the verge to make/or not make a big advance in price. The weekly chart displays a possible bullish triangle (see Figure 1)which recently was broken to the upside. If we manage to close above 1.6350, on a weekly basis, there is a high probability that cable will see a dramatic upside movement. However the most important point is the last swing high 1.6738 which is a critical point in order for cable to experience a really big move. Since the 2007-2008 crisis cable was trading within a frustrating trading range, and if you take in consideration the sell of that GBP/USD experienced at beginning of the year and where we stand right now you can see the bigger picture.
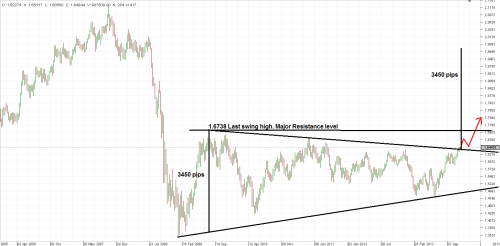
At the beginning of the year after that massive sell of everyone was calling for a crash, and yet cable was able to not only consume the entire sell of but to surge to new levels not seen since 2011.The best conclusion you can draw from here is that you have to consider both sides of the market and never rule out the possibility of the market to do the unexpected. Also if we want to project the length of the next upside move we can measure the trading range and project it to the upside see (Figure 1).
Fundamentally speaking, UK is set to grow faster than any other Western economy. This year the economic data where very strong and supportive for GBP. The UK's GDP has shown the fastest growth for three years and rose by 0.8% according to the last figures.
For now I'm definitely looking for a good spot to enter and ride this new trend, but timing the market is key as you don't want to be stuck with a position that does nothing, so patience is key as well.
Best Regards,
Daytrader21

- Figure 1. GBP/USD Weekly bullish triangle pattern.
At the beginning of the year after that massive sell of everyone was calling for a crash, and yet cable was able to not only consume the entire sell of but to surge to new levels not seen since 2011.The best conclusion you can draw from here is that you have to consider both sides of the market and never rule out the possibility of the market to do the unexpected. Also if we want to project the length of the next upside move we can measure the trading range and project it to the upside see (Figure 1).
Fundamentally speaking, UK is set to grow faster than any other Western economy. This year the economic data where very strong and supportive for GBP. The UK's GDP has shown the fastest growth for three years and rose by 0.8% according to the last figures.
For now I'm definitely looking for a good spot to enter and ride this new trend, but timing the market is key as you don't want to be stuck with a position that does nothing, so patience is key as well.
Best Regards,
Daytrader21