This is just a small preview from my latest article, if you wish to read the entire article please follow the link: Smart Money Divergence
Since we already outlined the core principles of SM divergence it's time to look at the most recent price action and look at:
Timing the market when using this SM divergence techniques can help you anticipate market reversals because smart money can't hide from you, their movements have huge footprints, just that you have to learn how to read it. In the same above figure we have another major opportunity in Jun, where the move in cable was not confirmed neither by fiber nor by DXY. If the dollar was so weak why couldn't EUR/USD post a HH which should have been complemented with LL in DXY, which never happened.
USDX making HH and the trading pair making LL is normal. However, either the trading pair or USDX can fail to make HH or LL, when we see this is a footprint of smart money moving into the market. You might not see or anticipate a high/low forming in EUR/USD but it will be triggered by the USDX low/high which is a sign of SM operating in the market. The power of this simple tool will make more sense to you as you start practicing and trade alongside SMART MONEY.
Best Regards,
Daytrader21
Since we already outlined the core principles of SM divergence it's time to look at the most recent price action and look at:
- Who is behind the market moves;
- How to use USDX to qualify setups;
- Looking for cracks in correlation between the pairs;
- How can we detect the move prior to them unfolding;

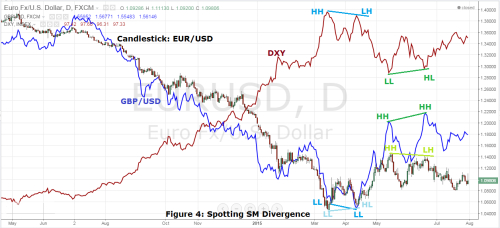
Figure 4: Spotting SM Divergence
Timing the market when using this SM divergence techniques can help you anticipate market reversals because smart money can't hide from you, their movements have huge footprints, just that you have to learn how to read it. In the same above figure we have another major opportunity in Jun, where the move in cable was not confirmed neither by fiber nor by DXY. If the dollar was so weak why couldn't EUR/USD post a HH which should have been complemented with LL in DXY, which never happened.
USDX making HH and the trading pair making LL is normal. However, either the trading pair or USDX can fail to make HH or LL, when we see this is a footprint of smart money moving into the market. You might not see or anticipate a high/low forming in EUR/USD but it will be triggered by the USDX low/high which is a sign of SM operating in the market. The power of this simple tool will make more sense to you as you start practicing and trade alongside SMART MONEY.
Best Regards,
Daytrader21