Hello traders,
How can we analyze the Daily chart of EUR/USD - the hottest pair today
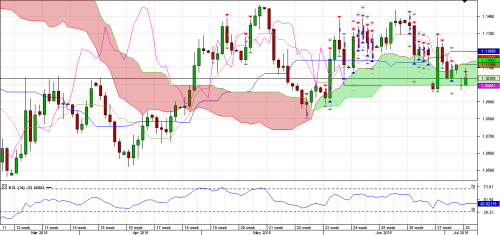 Since March we can see very interesting formed and forming patterns. First it formed a false double top. Since the middle of April to middle of May there was a trend to reach the maximum of the pair =1.146 It was again with similar to triple top and/or channel up pattern. After this the big correction came to fall to the bottom of the Ichimoku cloud and after forming the second bottom it again started a trend with a lot of tops and bottoms until the middle of June when it again reached 1.14 and more. Now there are 2 gaps 1 close and another maybe in process of closing due to Greece maneuvers. Fighting with level 1.1
So the technical analysis says that if level 1.14 is broken the channel up will start, if the Ichimoku cloud is broken the trend down will continue (1.095 approximately). The important thing is the Fundamental analysis. Greek No - will it weaken the euro or the opposite. FOMC decision - will they increase the interest rate - (Big probability of September rate hike exist but I suppose there will be an early surprise) There is more force down than up then why does euro still so stubbornly goes up. It was already time for parity. I think Fed will not be happy with parity - this is why they somehow help euro.
Only my point of view
Be happy and lucky all