The USDCAD has been showing strong upside momentum for the last two weeks, but momentum was seen slowing down up against a resistance confluence area on the daily chart.
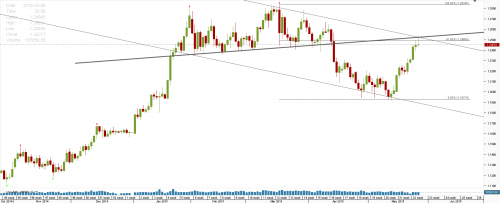
The chart below shows a combination of trendline resistance, channel resistance, as well as the 61.8% Fibonacci level from highs to lows.
The chart below shows a combination of trendline resistance, channel resistance, as well as the 61.8% Fibonacci level from highs to lows.