 If last week was all about the FX move, this week the metals are going to be on the front page. With silver breaking key support level at $18.20 this marks the stage for further downside movements. Silver was developing and completed an descending triangle over the last 1.2 years. I've been speaking about this developments in the silver market more than 5 months ago, making the case for a break lower, you can find that post in my history blog post.
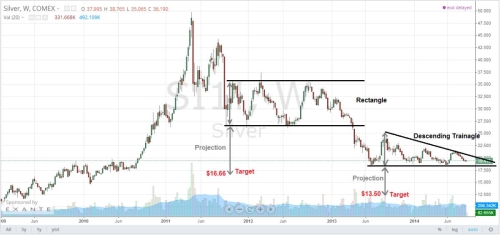
Figure 1. Silver Weekly Chart
Since we broke the key support level $18.20 as per the above chart I have in mind 2 targets for silver, first $16.66 the rectangle projection and the final target and hopefully the bottom in silver the $13.50 the descending triangle projection.Not only that silver has broke to the downside but it is leading the way down for the metal commodity market (see Figure 2) as right now everything points down and it may be the case gold will follow suit and break to new major lows as well. This sell off in metals align perfectly with the seasonality cycles which suggest the sell of should continue further into Dec/Jan where we may put a low in place. Usually May/Jun often produce the low in Gold and the other key months tend to be Dec/Jan.
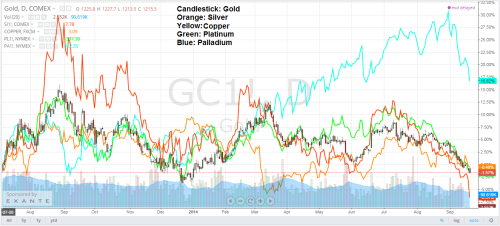
Figure 2. Metals Outlook.
Daytrader21