 Since we're getting close to end for good the "glorious" FED QE program it's time for my last update on the famous EUR/USD Fed Taper Effect that was a good map for providing the direction for EUR/USD since beginning of the year.
You only need to watch the "technical effect" on EUR/USD, without the need to know any other details from Fed monetary policy and their next steps in order for you to be able to trade successfully EUR/USD.
You can find more details of my previous post on this subject here: EUR/USD Fed Tapering Effect and here: EUR/USD Fed Tapering Effect (part 2)
For the September FOMC meeting is not about the Taper anymore but more about the forward guidance and hints for the first rate hike. And majority of traders will look for any change in the FOMC statement, and particularly if FED will drop the "considerable time" guideline from their statement.
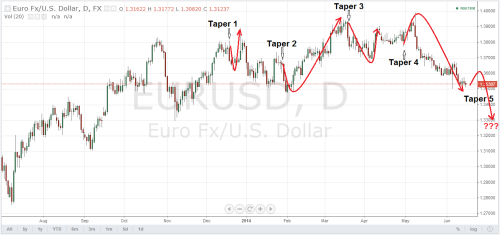
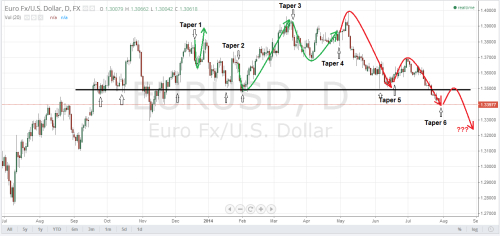
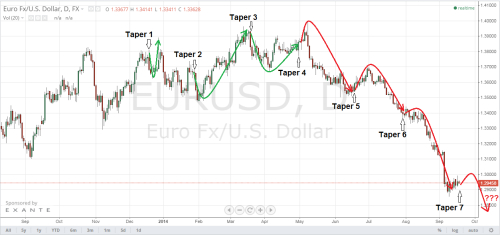
Figure 1. EUR/USD Fed Taper Effect
On this post I want to focus more on the "price effect" that the tapering process has produce in the EUR/USD pair since beginning of the year (see Figure 1). On the bottom is the current update where the first 2 figures are from previous posts. It's quite clear that since taper 4, initially we got a slightly retracement in the dollar, or at least a pause, before to resume the broad based dollar strength. And as the tapering process was developing we can see how the dollar strength has become more abruptly. We don't even need to look at the fundamental to get an explanation for this behavior, not that it wouldn't help, but my point is that just looking at the technicals alone you could have traded a big fundamental issue, like the taper process.
Best Regards,
Daytrader21