Following the success and the popularity of my last blog post on trading movies pattern I've decided to take this one step further. You can find this blog post and the chart that I'm speaking about here:"The Wolf of Wall Street Movie Review". It was a chart showing the pattern between Wall Street movies and the Stock market crash.
This time we're going to look at every Wall Street movie ever made and this time you will see that Wall Street movies not only that have predicted some of the most stock market crashes but it has also predicted some bottoms. We always must consider both side of the market and it seems this pattern is not an exception of the rule.
Now that we have the complete picture we can see how every major/minor top or bottom happened right before or after the release of an Wall Street Movie. Can we presume that Wolf Of Wall Street because has already made the top rank based on the more than 100 Million revenue, this to be the biggest market Crash we have ever had? If you're asking me that's to far to go with our analysis.
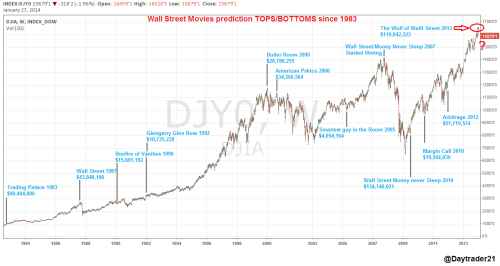
- Figure 1. Stock Market Crash - Wall Street Movie pattern.
What I found interesting is that if you look back since 2000 every top made was tied down to a Wall Street movie and the real question is does history will repeat itself and will "Wolf of Wall Street" predict the next stock market crash, that remains to be seen.
Now to make things even more interesting, did you know that even the 1929 stock market crash that lead to the Great Depression, was also tied down to a Wall Street Movie which coincidence or not was called "The wolf of wall street" Based on Wikipedia :"The plot concerns a ruthless trader (Bancroft) who corners the market in copper and then sells short, making a fortune and ruining the fiance of his maid."
Wait! because there is more, not only that in 1929 and 2014 there have been made two movies with the same title:" The Wolf of Wall Street" but it seems that the S&P 500 Index is following the 1929 price action (see Figure 2) which is a fractal for today's price action.
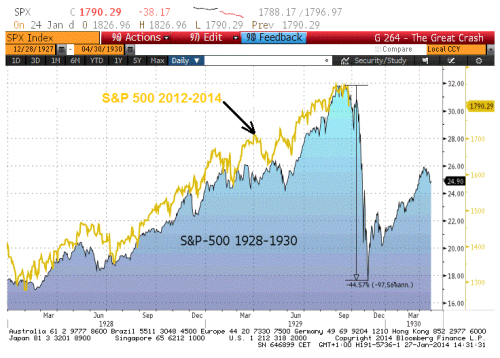
- Figure 2. S&P500 2012-2013 correlation with S&P500 1928-1930 price action.
It seems that Wall Street movies have been predicted every stock market high over the past 84 years, why this time should be any different?
Best Regards,
Daytrader21.