
Although I'm using many tools to forecast the market by far the most interesting approach I'm using is Fractals. There are many ways to skin a cat and that certainly applies to market analysis methods as well. There are no guarantees when it comes to defining price movements but in my humble opinion the most interesting approach a trader can apply is the philosophy that a market is fractal in nature. Fractals not only that can explain price movement but it can give you a road map, so to speak, for the future price action.
I have been writing an extensive article where you can find out more about this subject and more you can see some Fractals that I'm currently following, here you go: How Fractals can Explain Market Movements
One interesting fractal that I'm currently following is the 1989 USD/JPY (see Figure 1) which is a fractal for today's price action and a map to guide you. This suggest that we may see a big correction before to continue upwards, but you must be very flexible and let the price guide us. I'm already short USD/JPY and in profit more than +100 pips on this trade so far the market seems following our fractal.
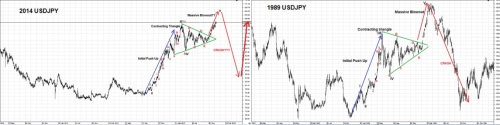
- Figure 1. 1989 USD/JPY Fractal for today price action (click to enlarge).
Just a quick reminder, USD/JPY it may or may not behave as I'm forecasting in my blog post, what is more important is to have a plan and be flexible enough if the market doesn't follow your forecast to abandon your bias and go with the market instead.
Best Regards,
Daytrader21.