Here are the missing images for the "False Trend Break" section:
► False Trend Break
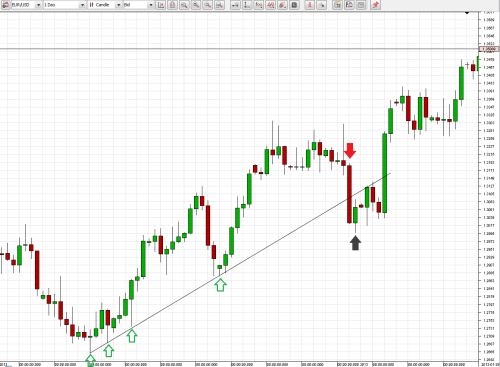
Sometimes, price breaks below an up-trend-line but then reverses to move much higher. It moves back to cross the trend-line and continues upwards, in the original trend direction. This is a false trend break. Here is an example on the EUR/USD Daily chart. Price breaks below the trend-line (red arrow). Then, price reverse completely to cross the trend-line and move much higher (black arrow):