Here are the missing images for the "Regular Trend Break" section:
► Regular Trend Break
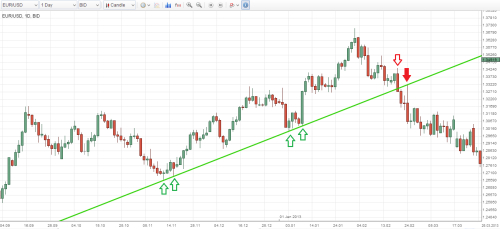
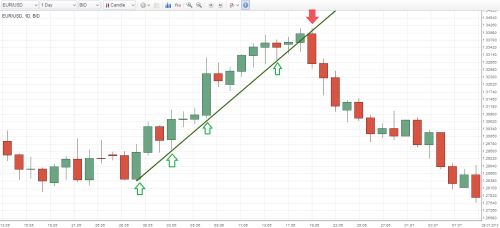
Usually when an up-trend-line breaks down, price will continue much lower. Price moves immediately lower, or pullbacks first to test the trend-line and then moves much lower. Here is an example of an up-trend on the EUR/USD Daily chart. The up-trend-line holds price nicely at first. This is marked with green arrows. However, at a certain point price breaks below the trend-line (red arrow). Price then continues much lower:
Here is another example of a regular trend break. The up-trend-line holds price nicely at first (green arrows). Afterwards, price breaks below the trend-line (red arrow). Price pulls back higher to retest the trend-line (filled red arrow). Then, price continues much lower: