
The USDJPY appears to be trading sideways for most of the year. The daily chart below, shows that 118.85 has become significant support as price has bounced from that level several times
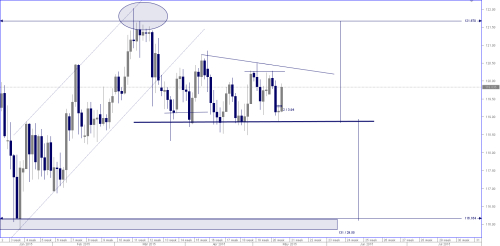
Often in a range type environment, we can measure an equal distance from the high of the range to the low, to determine a possible target. The above chart has done exactly that to determine an approxiamete target in the case of a bearish break to be at 116.16.
The chart also shows a downward trendline in play as well.
The Hourly chart shows us that the 76.4% Fib level has held the price to the upside and so far is showing signs of a possible reversal.
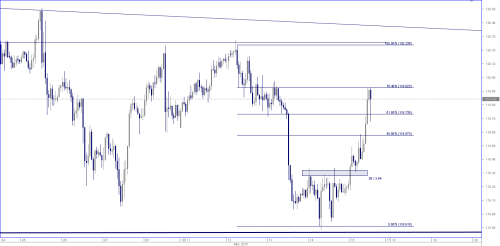
Bear in mind that the Daily candlestick is still showing to be very bullish. It may be prudent to wait for a Daily reversal Candlestick before attempting a short position, but so far the level is looking like it has good potential.