
ABSTRACT
The strategy CONTEST_STK_FLTR obtained the third position at the Strategy Contest in August 2020.
The Intention is to get profit from trend behaviors of pair NZD/USD. The criterion for evaluating the recognition of the trend is based on different constraints that must be obtained jointly.
INDICATORS
The strategy include a simple moving average, a fast stochastic and standard stochastic indicators.
In financial applications a simple moving average (SMA) is the unweighted mean of the previous n values and this calculation can have a latency often indicated with shift.
The stochastic oscillator is one of the most used and well-known algorithmic analysis tools for traders. But perhaps few know that its creation dates back to 1970 thanks to an intuition of George Lane. This oscillator assesses how close the bars are to the maximum or minimum recorded in a certain period. The intuition consists of what is normally the bar closures near their maximum are typical of upward trends, while bar closures towards the minimum are indicative of a bearish trend. Without entering in the calculation details as most of the analysis software now foresees its construction, suffice it to say that the original calculation is based on the current value compared to the minimum and maximum price values recorded in a certain period. From here arises a defined value% K from which it then determines its average defined% D.
There are three stochastic versions: the fast stochastic (fast stochastic, which represents the original Lane formula in which the% K line is obtained by linking the closing price to a certain price range (to 5 periods), while the% D line is simply the moving average (normally 3 periods) of the% K line.
In this strategy it is utilized the Stochastic F with the standard periods in the H1 frame and the Stochastic with the Standard periods in 1Min Frame.
BUY TRADING LOGIC -SETTING
H1 Frame
- The first constraint concerns the Stochastic Indicator.
When in H1 the variable Fast% K is greater than Fast% D and Fast% D is lower than 75 the strategy has the first requirement to the buy.
- The second requirement for the buy is on the candle closing variables, H1 Candle Close shifted of one period (shift 1) should be greater than the H1 Previous candle Close(shift equal 2) .
- The third instead is on moving average, H1 Candle Close should be greater than SME_24 where SMA_24 is a moving average with 24 as a period in H1 basis (Third Selection for the buy).
1 MIN Frame
Next to these, the strategy also requires that in 1Min candle the STOCH indicator Slow% D should be greater than 80.
BUY AT MARKET
When are verified this requirements is recognized the strength of the Bullish trend and then it can open a Buy trade at market.
The setting for the contest are SL 160 TP 5.
SELL TRADING LOGIC -SETTING
The strategy have Simmetrical selection for the Sell.
H1 Frame
When in H1 the variable Fast% K is lower than Fast% D and Fast% D is greater than 25 the strategy has the first requirement to sell.
- The second requirement for the sell is on the candle closing variables, H1 Candle Close shifted of one period (shift 1) should be lower than the H1 Previous candle Close(shift equal 2) .
- The third instead is on moving average, H1 Candle Close should be greater than SME_24 where SMA_24 is a moving average with 24 as a period in H1 basis (Third Selection for the buy).
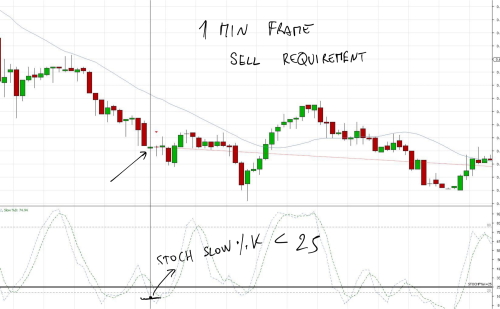
1 MIN Frame
Next to these, the strategy also requires that in 1Min candle the STOCH indicator Slow% D should be lower than 20.
SELL AT MARKET
When are verified this requirements is recognized the strength of the bearish trend and then it can open a Sell trade at market.
The setting for the contest are SL 160 TP 5.
STRATEGY LOGIC CHART EXPLANATION
In this images are graphically explained the requirements of the strategy.


The strategy CONTEST_STK_FLTR obtained the third position at the Strategy Contest in August 2020.
The Intention is to get profit from trend behaviors of pair NZD/USD. The criterion for evaluating the recognition of the trend is based on different constraints that must be obtained jointly.
INDICATORS
The strategy include a simple moving average, a fast stochastic and standard stochastic indicators.
In financial applications a simple moving average (SMA) is the unweighted mean of the previous n values and this calculation can have a latency often indicated with shift.
The stochastic oscillator is one of the most used and well-known algorithmic analysis tools for traders. But perhaps few know that its creation dates back to 1970 thanks to an intuition of George Lane. This oscillator assesses how close the bars are to the maximum or minimum recorded in a certain period. The intuition consists of what is normally the bar closures near their maximum are typical of upward trends, while bar closures towards the minimum are indicative of a bearish trend. Without entering in the calculation details as most of the analysis software now foresees its construction, suffice it to say that the original calculation is based on the current value compared to the minimum and maximum price values recorded in a certain period. From here arises a defined value% K from which it then determines its average defined% D.
There are three stochastic versions: the fast stochastic (fast stochastic, which represents the original Lane formula in which the% K line is obtained by linking the closing price to a certain price range (to 5 periods), while the% D line is simply the moving average (normally 3 periods) of the% K line.
In this strategy it is utilized the Stochastic F with the standard periods in the H1 frame and the Stochastic with the Standard periods in 1Min Frame.
BUY TRADING LOGIC -SETTING
H1 Frame
- The first constraint concerns the Stochastic Indicator.
When in H1 the variable Fast% K is greater than Fast% D and Fast% D is lower than 75 the strategy has the first requirement to the buy.
- The second requirement for the buy is on the candle closing variables, H1 Candle Close shifted of one period (shift 1) should be greater than the H1 Previous candle Close(shift equal 2) .
- The third instead is on moving average, H1 Candle Close should be greater than SME_24 where SMA_24 is a moving average with 24 as a period in H1 basis (Third Selection for the buy).
1 MIN Frame
Next to these, the strategy also requires that in 1Min candle the STOCH indicator Slow% D should be greater than 80.
BUY AT MARKET
When are verified this requirements is recognized the strength of the Bullish trend and then it can open a Buy trade at market.
The setting for the contest are SL 160 TP 5.
SELL TRADING LOGIC -SETTING
The strategy have Simmetrical selection for the Sell.
H1 Frame
When in H1 the variable Fast% K is lower than Fast% D and Fast% D is greater than 25 the strategy has the first requirement to sell.
- The second requirement for the sell is on the candle closing variables, H1 Candle Close shifted of one period (shift 1) should be lower than the H1 Previous candle Close(shift equal 2) .
- The third instead is on moving average, H1 Candle Close should be greater than SME_24 where SMA_24 is a moving average with 24 as a period in H1 basis (Third Selection for the buy).
1 MIN Frame
Next to these, the strategy also requires that in 1Min candle the STOCH indicator Slow% D should be lower than 20.
SELL AT MARKET
When are verified this requirements is recognized the strength of the bearish trend and then it can open a Sell trade at market.
The setting for the contest are SL 160 TP 5.
STRATEGY LOGIC CHART EXPLANATION
In this images are graphically explained the requirements of the strategy.


