
In this article, I will talk about technical analysis patterns in theory and practical examples. The study of these patterns helps us in the development of any strategy. In particular, they are very helpful in optimizing overbought and oversold strategies (like my contest strategy). These patterns can be used as trade confirmation of an overbought / oversold signal.
Looking for patterns in financial time series is the key objective of a technical analyst. These patterns are indicative of reversal trend or continuation trend.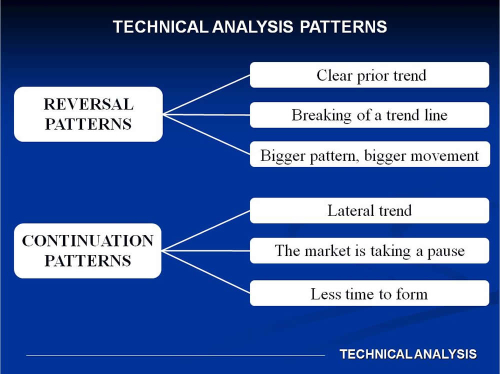
Formally, patterns in financial time series from the point of view of the technical analysis are "images or formations that appear on price charts." These can be classified into different categories and have predictive value.
The reversal patterns
These patterns announcing that it is causing a significant change in the trend. The reversal patterns have common characteristics, among which we can mention:
• There must be a precise previous trend, that is, there cannot be a trend change if there is no clear previous trend.
• In general, the first change sign is the breaking of a trend line. It is important to note that the opposite is not true, the trend line break does not necessarily mean a change in the trend, and this can mean only a change in the trend slope.
• While more big is the pattern, more big is the movement associated with their occurrence, where "more big” refers to the height and width of the pattern, the height measures the volatility and the width, the time in which it is formed.
As is standard in technical analysis, does not mean it always will produce all these characteristics, only that there is a significant probability of occurring.
The continuation patterns
These patterns indicate that lateral movement that shows the chart is a pause and then the original trend will continue. The continuation patterns take less time to form that the reversal patterns.
Importantly, both patterns (continuation and reversal) are not deterministic, they are stochastic in nature, that is, when these patterns are formed there is a significant probability that the market movement behaves as expected, but we must remember that there is also the probability, (lower but not null), that this is not so.
Now, we will see some patterns examples:
First, we will see reversal patterns examples:
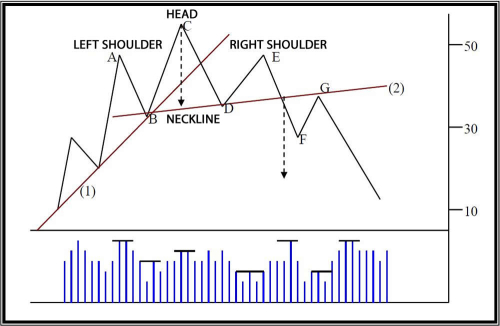 Fig.1: The head and shoulders pattern
It’s the reversal pattern best known, and probably the most successful to predict trend changes. On the fig. 1, we can see a representation of it, in it can be seen a series of rising peaks and valleys that begin to lose strength. Underlying, what is happening is that the forces of supply and demand are in momentary balance.
A head and shoulders pattern generally has the following specifications:
1. A prior uptrend.
2. The left shoulder (point A) has a significant volume, followed by a decline to point B with less volume.
3. A rise to a new high (point C), but with less volume than point A.
4. A decline that drops below the crest of the point A, breaks the trend line (1) and approaches the previous low (point D).
5. A third price increase (point E) with significantly less volume and the head cannot overcome (point C).
6. A drop below the base of the neckline, confirming the pattern (2).
7. Finally, after the pattern is confirmed, a recovery to (point G).
This pattern enables a target price after confirmation, this objective is set as the distance between the head point (point C) and the neckline (2) projected down from the neckline. In the fig. 1, we see this through the dotted arrow. This is a minimum target, that is, the prices, as minimum, reach to that zone.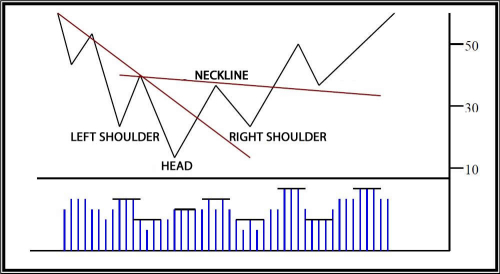 Fig. 2: Inverted Head and Shoulders Pattern
As we can see in the fig. 2, it’s the inverse image of the previous pattern and therefore is a reversal sign from bearish to bullish. On the fig. 2, we can see a representation. It is important to note that in this case the volume is vital in the neckline breaking zone, after the right shoulder, as a pattern confirmation and the consequent uptrend ahead. In the fig. 2, we can note the significantly increasing volume in the neckline breaking zone.
Also, the return movement or pullback is more common in the Inverted Head and Shoulders Pattern and volume should decrease at this point.
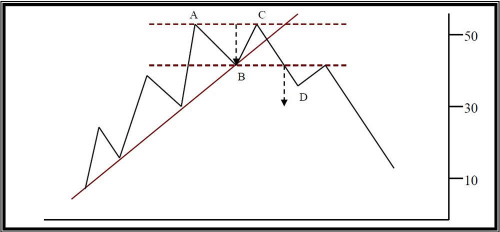 Fig. 3: The Double Top Pattern.
The Double Top and Double Bottom patterns, after the head and shoulders pattern, are the easiest to identify.
In fig. 3 we can see the representation of the double top pattern. As we can see, the bullish strength decrease and the maximum of the point C cannot exceed the maximum of the point A. Then, the trend line break occurs, and finally, the pattern is confirmed when prices fall below the price level of the point B, the dotted arrow represents the minimum target prices below the break of the point B imaginary line.
The distance between the imaginary line of points A and C and the imaginary line of point B. projected below the imaginary line of point B, is the minimum target expected.
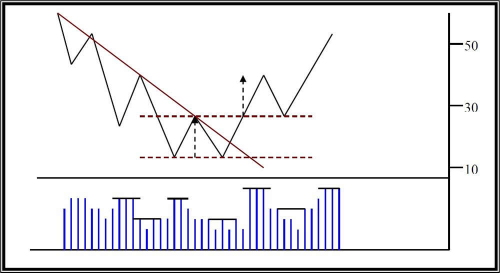 Fig. 4: The Double Bottom Pattern.
The double bottom case is analogous; we can see it in the fig. 4, just remember again that, in the case of bearish to bullish, the volume should be important in bullish breakout after the second bottom (at the fig. 4, we can see the significant volume increase in the break zone of the resistance), the dotted arrow indicates the minimum target that is projected from the break zone of the resistance (analogous to the double top case). Now, we will see some examples of the continuation patterns: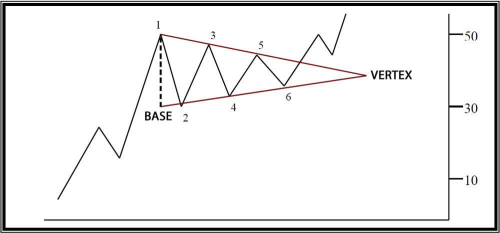 Fig. 5: The Triangle.
There are three types of triangles: symmetrical, ascending and descending. The triangle is an intermediate pattern referring to the time it takes to form. Some characteristics of all triangles are:
• The triangles volume tends to decrease as the price crosses the convergence channel, but should grow significantly in the break. The convergence channel is this zone, between the trend lines.
• The triangles have a limit time of resolution, which is the time of trendlines convergence (the triangle vertex in the fig. 5 is the time limit).
• Measuring the vertical height in the widest part of the triangle, we obtain the minimum target that the prices should scroll in the corresponding direction at the termination time. (In the fig. 5 we can see a previous uptrend, then, this distance will be the minimum target, projected above the resolution point).
The symmetrical triangle that we see in the fig. 5 represents a pause of the current trend, after which, the market will continue to move in the same direction. That is, if we have an uptrend, like the fig. 5, then, the resolution will be bullish, and if we have a downtrend, the resolution will be bearish. We see here a symmetrical triangle pattern with six points, the vertex is the top for resolution, and the wider part, is the base. For there to be a triangle (of any kind) must have at least four change points, in the fig.5 we see six.
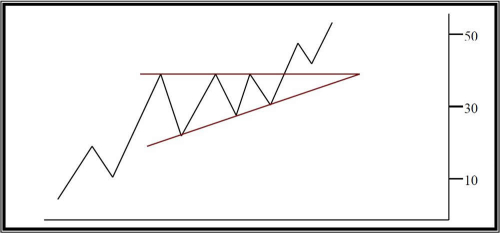 Fig. 6: The Ascending Triangle.
The ascending triangle that we see in the fig. 6 is a variation of the symmetrical, but its resolution is bullish, however it is considered within the continuation patterns because it appears mostly on bullish market movements.
Note that the upper trend line is flat and the lower trend line is bullish, this shows that the buyer’s strength exceeds the seller’s strength.
It’s important to note that if this pattern appears in downtrend, will be considered a reversal pattern from bearish to bullish, and in this case, it is not a continuation pattern.
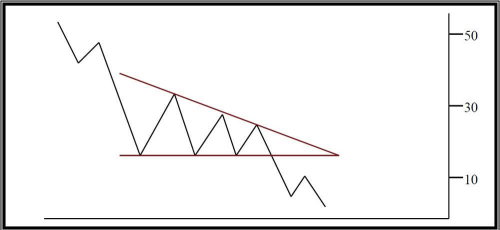 Fig. 7: The Descending Triangle.
The descending triangle that we see in the fig. 7 , have, (unlike the previous) a bearish resolution, analogous to the ascending triangle, it is considered a continuation pattern, because appearing mostly in bearish market movements.
Note that the lower trend line is flat and the top is bearish, denoting, as opposed to the previous, more force by sellers.
Again, it’s important to note that if this pattern appears in uptrend, is considered a reversal pattern from bullish to bearish, and in this case, it is not a continuation pattern.
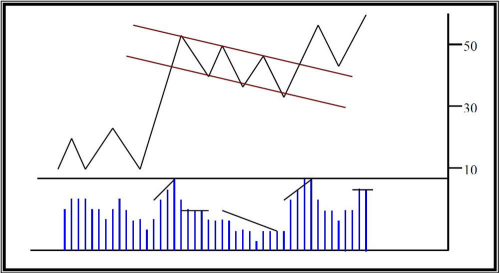 Fig. 8: The Flag Pattern.
In the fig. 8, we can see the flag pattern, these patterns are quite common and represent a brief pause in a sudden prices movement and after, the movement will continue in the same direction. One of the conditions for the existence of this pattern is that it is preceded by a sudden movement (almost perpendicular).
During the development of this pattern, we observe a large decrease in volume, but the volume increases abruptly at the end.
This pattern occurs approximately at the half market movement (uptrend or downtrend), that is, it is expected that there is a continuation of the initial movement of the same size that from the initial break until the pattern. This distance is expected to be repeated at the end in the same direction.
We can see that the pattern looks like a small parallelogram leaning in the opposite direction to the direction of the original trend (which then stays). The volume is reduced during the formation and increased in the exit.
This concludes the article. I want to thank to Dukascopy for the opportunity to share this knowledge with the Dukascopy community. Good luck & good trade to all.
Looking for patterns in financial time series is the key objective of a technical analyst. These patterns are indicative of reversal trend or continuation trend.

Formally, patterns in financial time series from the point of view of the technical analysis are "images or formations that appear on price charts." These can be classified into different categories and have predictive value.
The reversal patterns
These patterns announcing that it is causing a significant change in the trend. The reversal patterns have common characteristics, among which we can mention:
• There must be a precise previous trend, that is, there cannot be a trend change if there is no clear previous trend.
• In general, the first change sign is the breaking of a trend line. It is important to note that the opposite is not true, the trend line break does not necessarily mean a change in the trend, and this can mean only a change in the trend slope.
• While more big is the pattern, more big is the movement associated with their occurrence, where "more big” refers to the height and width of the pattern, the height measures the volatility and the width, the time in which it is formed.
As is standard in technical analysis, does not mean it always will produce all these characteristics, only that there is a significant probability of occurring.
The continuation patterns
These patterns indicate that lateral movement that shows the chart is a pause and then the original trend will continue. The continuation patterns take less time to form that the reversal patterns.
Importantly, both patterns (continuation and reversal) are not deterministic, they are stochastic in nature, that is, when these patterns are formed there is a significant probability that the market movement behaves as expected, but we must remember that there is also the probability, (lower but not null), that this is not so.
Now, we will see some patterns examples:
First, we will see reversal patterns examples:
 Fig.1: The head and shoulders pattern
It’s the reversal pattern best known, and probably the most successful to predict trend changes. On the fig. 1, we can see a representation of it, in it can be seen a series of rising peaks and valleys that begin to lose strength. Underlying, what is happening is that the forces of supply and demand are in momentary balance.
A head and shoulders pattern generally has the following specifications:
1. A prior uptrend.
2. The left shoulder (point A) has a significant volume, followed by a decline to point B with less volume.
3. A rise to a new high (point C), but with less volume than point A.
4. A decline that drops below the crest of the point A, breaks the trend line (1) and approaches the previous low (point D).
5. A third price increase (point E) with significantly less volume and the head cannot overcome (point C).
6. A drop below the base of the neckline, confirming the pattern (2).
7. Finally, after the pattern is confirmed, a recovery to (point G).
This pattern enables a target price after confirmation, this objective is set as the distance between the head point (point C) and the neckline (2) projected down from the neckline. In the fig. 1, we see this through the dotted arrow. This is a minimum target, that is, the prices, as minimum, reach to that zone.
 Fig. 2: Inverted Head and Shoulders Pattern
As we can see in the fig. 2, it’s the inverse image of the previous pattern and therefore is a reversal sign from bearish to bullish. On the fig. 2, we can see a representation. It is important to note that in this case the volume is vital in the neckline breaking zone, after the right shoulder, as a pattern confirmation and the consequent uptrend ahead. In the fig. 2, we can note the significantly increasing volume in the neckline breaking zone.
Also, the return movement or pullback is more common in the Inverted Head and Shoulders Pattern and volume should decrease at this point.
 Fig. 3: The Double Top Pattern.
The Double Top and Double Bottom patterns, after the head and shoulders pattern, are the easiest to identify.
In fig. 3 we can see the representation of the double top pattern. As we can see, the bullish strength decrease and the maximum of the point C cannot exceed the maximum of the point A. Then, the trend line break occurs, and finally, the pattern is confirmed when prices fall below the price level of the point B, the dotted arrow represents the minimum target prices below the break of the point B imaginary line.
The distance between the imaginary line of points A and C and the imaginary line of point B. projected below the imaginary line of point B, is the minimum target expected.
 Fig. 4: The Double Bottom Pattern.
The double bottom case is analogous; we can see it in the fig. 4, just remember again that, in the case of bearish to bullish, the volume should be important in bullish breakout after the second bottom (at the fig. 4, we can see the significant volume increase in the break zone of the resistance), the dotted arrow indicates the minimum target that is projected from the break zone of the resistance (analogous to the double top case). Now, we will see some examples of the continuation patterns:
 Fig. 5: The Triangle.
There are three types of triangles: symmetrical, ascending and descending. The triangle is an intermediate pattern referring to the time it takes to form. Some characteristics of all triangles are:
• The triangles volume tends to decrease as the price crosses the convergence channel, but should grow significantly in the break. The convergence channel is this zone, between the trend lines.
• The triangles have a limit time of resolution, which is the time of trendlines convergence (the triangle vertex in the fig. 5 is the time limit).
• Measuring the vertical height in the widest part of the triangle, we obtain the minimum target that the prices should scroll in the corresponding direction at the termination time. (In the fig. 5 we can see a previous uptrend, then, this distance will be the minimum target, projected above the resolution point).
The symmetrical triangle that we see in the fig. 5 represents a pause of the current trend, after which, the market will continue to move in the same direction. That is, if we have an uptrend, like the fig. 5, then, the resolution will be bullish, and if we have a downtrend, the resolution will be bearish. We see here a symmetrical triangle pattern with six points, the vertex is the top for resolution, and the wider part, is the base. For there to be a triangle (of any kind) must have at least four change points, in the fig.5 we see six.
 Fig. 6: The Ascending Triangle.
The ascending triangle that we see in the fig. 6 is a variation of the symmetrical, but its resolution is bullish, however it is considered within the continuation patterns because it appears mostly on bullish market movements.
Note that the upper trend line is flat and the lower trend line is bullish, this shows that the buyer’s strength exceeds the seller’s strength.
It’s important to note that if this pattern appears in downtrend, will be considered a reversal pattern from bearish to bullish, and in this case, it is not a continuation pattern.
 Fig. 7: The Descending Triangle.
The descending triangle that we see in the fig. 7 , have, (unlike the previous) a bearish resolution, analogous to the ascending triangle, it is considered a continuation pattern, because appearing mostly in bearish market movements.
Note that the lower trend line is flat and the top is bearish, denoting, as opposed to the previous, more force by sellers.
Again, it’s important to note that if this pattern appears in uptrend, is considered a reversal pattern from bullish to bearish, and in this case, it is not a continuation pattern.
 Fig. 8: The Flag Pattern.
In the fig. 8, we can see the flag pattern, these patterns are quite common and represent a brief pause in a sudden prices movement and after, the movement will continue in the same direction. One of the conditions for the existence of this pattern is that it is preceded by a sudden movement (almost perpendicular).
During the development of this pattern, we observe a large decrease in volume, but the volume increases abruptly at the end.
This pattern occurs approximately at the half market movement (uptrend or downtrend), that is, it is expected that there is a continuation of the initial movement of the same size that from the initial break until the pattern. This distance is expected to be repeated at the end in the same direction.
We can see that the pattern looks like a small parallelogram leaning in the opposite direction to the direction of the original trend (which then stays). The volume is reduced during the formation and increased in the exit.
This concludes the article. I want to thank to Dukascopy for the opportunity to share this knowledge with the Dukascopy community. Good luck & good trade to all.