
I will try to explain in this article the underlying theory related to the overbought and oversold strategies. This is the strategy used by my contest strategy.
Charles Dow (considered the father of technical analysis) had noticed that any asset prices series experienced recurring cycles indefinitely. He noted three different phases related to price movements, whether in a bull or bear market.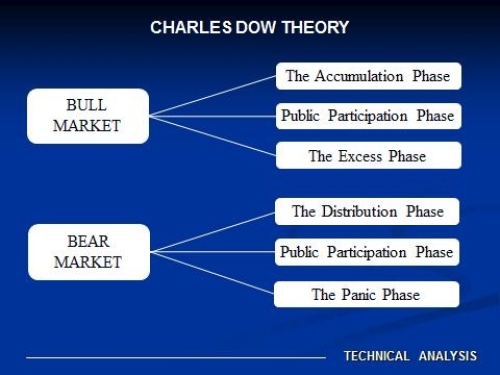
In a bull market, we have:
The Phase 1: The Accumulation Phase
The first phase of a bull market is no different from the last reaction of a bear market rally. Pessimism, which was excessive at the end of the bear market, still reigns at the beginning of a bull market. However, it is at this stage that the so-called "smart money" begins to accumulate. The prices are cheap, but nobody seems to want to buy. The first stage of a bull market is where a bottom is created. There are days with high volume and days with low volume.
The Phase 2: Public Participation Phase
The second phase of a bull market is usually the longest and usually has the largest percentage of value increase. It is a period marked by improved trading conditions and increased valuations in stocks.
The Phase 3: The Excess Phase
The third phase of a bull market is characterized by euphoria and excessive speculation. During the third and final phase, the public is fully involved in the market, valuations are excessive and confidence is extraordinarily high. This shows a mirror image to the first phase of the bull market.
In a bear market, we have:
The Phase 1: The Distribution Phase
This is the opposite of accumulation. The distribution marks the beginning of a bear market, when the "smart money" begins to realize that trading conditions are not as good as first thought and start selling. At this stage the public participates in the stock market and become willing buyers. The market begins to lose its strength.
The Phase 2: Public Participation Phase
Phase two of the bear market shows the longer movement. This is where the trend has been identified as bearish and the market begins to accelerate negatively. While conditions worsen, the liquidation continues.
The Phase 3: The Panic Phase
At the end of the bear market phase, all hope is lost. Valuations are low, but selling continues while participants seek to sell no matter what. The economic outlook is gloomy and forecasters predict fatalities. The market continues to fall until all the bad news completely determines the price. Once the price fully reflects the worst possible outcome, the cycle begins again.
And the cycle between the bull market and the bear market is repeated indefinitely.
The Trend
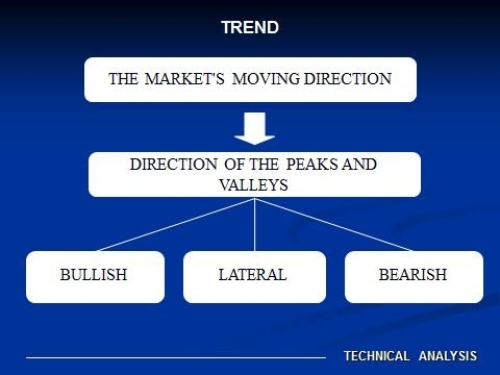
The trend can be defined as the direction in which the market is moving, but as market movements are generally in zigzags (peaks and valleys). Then we can say more precisely that the direction of these peaks and valleys make the market trend.
The market may have three trends: upward or bullish trend, downward or bearish trend and lateral trend, although the latter can also be defined as the trend absence.
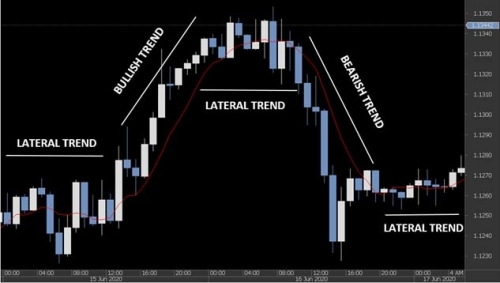
This is a 1 hour timeframe chart of the Euro / dollar pair between June 15 and June 17, 2020. We will use the same chart for further analysis in this article. In it, we can see the different trends: lateral trend, bullish trend and bearish trend.
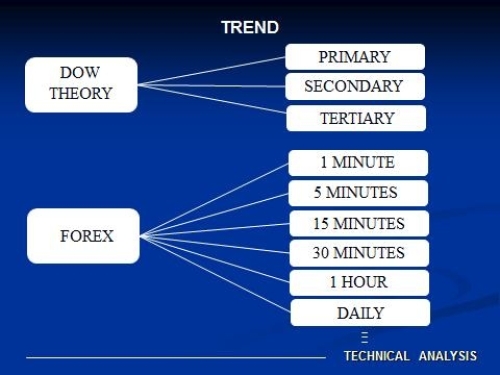
The trends are classified by how long they stay, if we speak of stocks, could be considered (as Charles Dow did), three trends, we have the long-term trend or primary (over a year), medium-term or secondary (one to four months) and short-term or tertiary (a few hours to several sessions), then we may have, for example, a bullish primary trend, together with secondary and tertiary bearish trends. In the Forex case we can see trends and therefore cycles, according to the timeframes (5 min, 15 min, 1 hour, etc.).
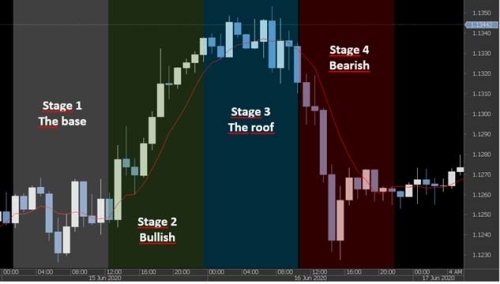
The Market Stages
Stan Weinstein, a technical analyst, given Dow's theories, develops his own theory that any asset price must be in one of four market stages. The four stages are: (stage 1) the base, (stage 2) the bullish stage, (stage 3) the roof and (stage 4) the bearish stage.
The foundation of this theory is the simple common sense, there is an old saying that says: "the branches of the trees never reach the sky, and its roots never get to hell", in a clear reference to that any asset price will have cycles or stages that are repeated, the problem is to determine precisely at which stage we are.
Stan Weinstein develops the theory in his book: "Stan Weinstein's Secrets for Profiting in Bull and Bear Markets" and as he points out, properly following the same, we could dispense with any other pattern. His theory captures the technical analysis essence because if we identify the precise market stage at which is found an asset price, we know the underlying trend all the time.
Now we will detail each stage:
Stage 1: the base
When an asset take some time descending, begin to lose down force, that is, the forces of supply and demand will begin to balance out. Then, a lateral movement starts, price movements occurring below and above the moving average. Furthermore, while the base is formed we will verify a volume down and when approaching the stage end usually volume start increasing, although prices remain, indicating that sales no longer lowers the value, because the demand strength is starting to be significant.
Stage 2: bullish
The value rises above its moving average together with a significant volume increase as confirmation. At the beginning of this stage, the moving average begins to have positive slope and this slope is maintained throughout the stage. Besides the price moves above the moving average, there are peaks and valleys upstream, where each peak is higher than the previous one, and the same for the valleys.
Stage 3: the roof
When the forces of supply and demand are balanced again, it begins to reveal a new lateral movement of prices. This stage is the upper mirror from the base stage, stage 1. At this point, the moving average loses its positive slope and happens to have zero slope, which is maintained during this stage. The value starts to operate above and below the moving average as was in stage 1.
Stage 4: Bearish
When the power of supply begins to overcome the demand force, bearish stage begins. The value falls below its moving average with increased trading volumes. The moving average begins to have negative slope and this slope is maintained throughout the stage, while the asset price remains below the moving average. Price movements downward form valleys and peaks, where each valley produces a new low and each peak is lower than the previous peak.
According to the theory developed, if we could identify the times of base (Stage 1) and roof (Stage 3), we could trade accordingly, knowing that inevitably the cycle is repeated continuously. That is, if we could identify with sufficient precision the base, we would buy, and if we could identify the roof, we would sell. That is exactly what we try with the overbought and oversold strategies. But to apply them correctly you need to know the underlying theory, which I have explained above.
The theory of the market stages is applicable to any timeframe (referring to FOREX)
Conclusion: Identifying the overbought / oversold moments
To try to identify the roof (overbought) or the base (oversold), we can use technical indicators called "Momentum indicators". Among them, two are very good indicators: RSI (Relative Strength Index) and CCI (Commodity Channel Index), although are used for the same purpose other momentum indicators such as stochastic, MACD, ADX, etc.
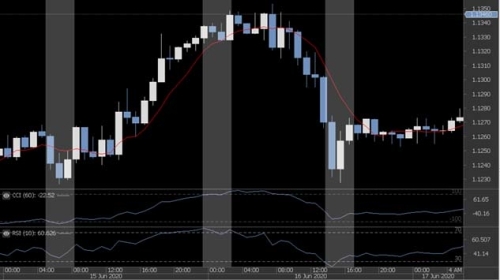
This chart is the same as we used for the market stages as I have said, with the addition of CCI and RSI indicators. We can see that at the beginning of what would be the stage 1: the base (end of previous Stage 4), the indicators are clearly marking oversold, just as at the end of stage 2 (bullish) and the start of stage 3 , the indicators are marking overbought. Finally at the end of what would be the stage 4 in the timeframe of the chart (bearish stage) (beginning of the next Stage 1 of the cycle), the indicators again show an oversold moment.
Well, this concludes the article. I want to thank to Dukascopy for the opportunity to share this knowledge with the community. Good luck & good trade to all.
Charles Dow (considered the father of technical analysis) had noticed that any asset prices series experienced recurring cycles indefinitely. He noted three different phases related to price movements, whether in a bull or bear market.

In a bull market, we have:
The Phase 1: The Accumulation Phase
The first phase of a bull market is no different from the last reaction of a bear market rally. Pessimism, which was excessive at the end of the bear market, still reigns at the beginning of a bull market. However, it is at this stage that the so-called "smart money" begins to accumulate. The prices are cheap, but nobody seems to want to buy. The first stage of a bull market is where a bottom is created. There are days with high volume and days with low volume.
The Phase 2: Public Participation Phase
The second phase of a bull market is usually the longest and usually has the largest percentage of value increase. It is a period marked by improved trading conditions and increased valuations in stocks.
The Phase 3: The Excess Phase
The third phase of a bull market is characterized by euphoria and excessive speculation. During the third and final phase, the public is fully involved in the market, valuations are excessive and confidence is extraordinarily high. This shows a mirror image to the first phase of the bull market.
In a bear market, we have:
The Phase 1: The Distribution Phase
This is the opposite of accumulation. The distribution marks the beginning of a bear market, when the "smart money" begins to realize that trading conditions are not as good as first thought and start selling. At this stage the public participates in the stock market and become willing buyers. The market begins to lose its strength.
The Phase 2: Public Participation Phase
Phase two of the bear market shows the longer movement. This is where the trend has been identified as bearish and the market begins to accelerate negatively. While conditions worsen, the liquidation continues.
The Phase 3: The Panic Phase
At the end of the bear market phase, all hope is lost. Valuations are low, but selling continues while participants seek to sell no matter what. The economic outlook is gloomy and forecasters predict fatalities. The market continues to fall until all the bad news completely determines the price. Once the price fully reflects the worst possible outcome, the cycle begins again.
And the cycle between the bull market and the bear market is repeated indefinitely.
The Trend

The trend can be defined as the direction in which the market is moving, but as market movements are generally in zigzags (peaks and valleys). Then we can say more precisely that the direction of these peaks and valleys make the market trend.
The market may have three trends: upward or bullish trend, downward or bearish trend and lateral trend, although the latter can also be defined as the trend absence.

This is a 1 hour timeframe chart of the Euro / dollar pair between June 15 and June 17, 2020. We will use the same chart for further analysis in this article. In it, we can see the different trends: lateral trend, bullish trend and bearish trend.

The trends are classified by how long they stay, if we speak of stocks, could be considered (as Charles Dow did), three trends, we have the long-term trend or primary (over a year), medium-term or secondary (one to four months) and short-term or tertiary (a few hours to several sessions), then we may have, for example, a bullish primary trend, together with secondary and tertiary bearish trends. In the Forex case we can see trends and therefore cycles, according to the timeframes (5 min, 15 min, 1 hour, etc.).
The Market Stages
Stan Weinstein, a technical analyst, given Dow's theories, develops his own theory that any asset price must be in one of four market stages. The four stages are: (stage 1) the base, (stage 2) the bullish stage, (stage 3) the roof and (stage 4) the bearish stage.

The foundation of this theory is the simple common sense, there is an old saying that says: "the branches of the trees never reach the sky, and its roots never get to hell", in a clear reference to that any asset price will have cycles or stages that are repeated, the problem is to determine precisely at which stage we are.
Stan Weinstein develops the theory in his book: "Stan Weinstein's Secrets for Profiting in Bull and Bear Markets" and as he points out, properly following the same, we could dispense with any other pattern. His theory captures the technical analysis essence because if we identify the precise market stage at which is found an asset price, we know the underlying trend all the time.
Now we will detail each stage:
Stage 1: the base
When an asset take some time descending, begin to lose down force, that is, the forces of supply and demand will begin to balance out. Then, a lateral movement starts, price movements occurring below and above the moving average. Furthermore, while the base is formed we will verify a volume down and when approaching the stage end usually volume start increasing, although prices remain, indicating that sales no longer lowers the value, because the demand strength is starting to be significant.
Stage 2: bullish
The value rises above its moving average together with a significant volume increase as confirmation. At the beginning of this stage, the moving average begins to have positive slope and this slope is maintained throughout the stage. Besides the price moves above the moving average, there are peaks and valleys upstream, where each peak is higher than the previous one, and the same for the valleys.
Stage 3: the roof
When the forces of supply and demand are balanced again, it begins to reveal a new lateral movement of prices. This stage is the upper mirror from the base stage, stage 1. At this point, the moving average loses its positive slope and happens to have zero slope, which is maintained during this stage. The value starts to operate above and below the moving average as was in stage 1.
Stage 4: Bearish
When the power of supply begins to overcome the demand force, bearish stage begins. The value falls below its moving average with increased trading volumes. The moving average begins to have negative slope and this slope is maintained throughout the stage, while the asset price remains below the moving average. Price movements downward form valleys and peaks, where each valley produces a new low and each peak is lower than the previous peak.
According to the theory developed, if we could identify the times of base (Stage 1) and roof (Stage 3), we could trade accordingly, knowing that inevitably the cycle is repeated continuously. That is, if we could identify with sufficient precision the base, we would buy, and if we could identify the roof, we would sell. That is exactly what we try with the overbought and oversold strategies. But to apply them correctly you need to know the underlying theory, which I have explained above.
The theory of the market stages is applicable to any timeframe (referring to FOREX)
Conclusion: Identifying the overbought / oversold moments
To try to identify the roof (overbought) or the base (oversold), we can use technical indicators called "Momentum indicators". Among them, two are very good indicators: RSI (Relative Strength Index) and CCI (Commodity Channel Index), although are used for the same purpose other momentum indicators such as stochastic, MACD, ADX, etc.

This chart is the same as we used for the market stages as I have said, with the addition of CCI and RSI indicators. We can see that at the beginning of what would be the stage 1: the base (end of previous Stage 4), the indicators are clearly marking oversold, just as at the end of stage 2 (bullish) and the start of stage 3 , the indicators are marking overbought. Finally at the end of what would be the stage 4 in the timeframe of the chart (bearish stage) (beginning of the next Stage 1 of the cycle), the indicators again show an oversold moment.
Well, this concludes the article. I want to thank to Dukascopy for the opportunity to share this knowledge with the community. Good luck & good trade to all.