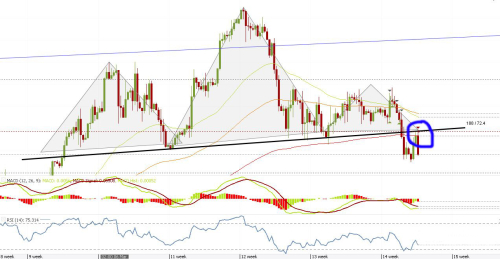
Hello, as you can see from the USD/CAD H4 chart, head and shoulders pattern was completed. Price went down, broking the neckline, right after that the price tried to go up, but it bounced back down again from the neckline level (which matches with 200 ema(red line)) , which is signal for upcoming down movement.