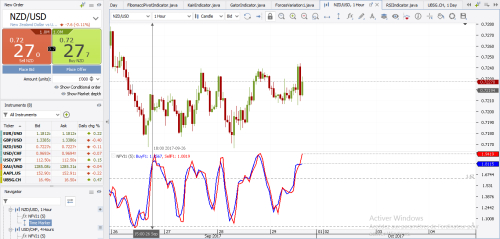
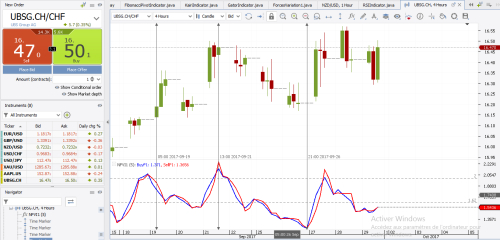
Based on my modeling the indicator « ForcesVariation1» is a "Scales" between the two forces that acting on the price simultaneously by measurihg the relative force of buyers represented by the blue curve (Buyf1) and the relative force of sellers (Sellf1) represented by the red curve. So at each moment you can see, which force is dominant on the price movement allowing you to follow the "good side" , so if the blue curve pass above the red one that’s mean that the buyers take price in theirs side the same , if the red curve pass below the blue one that’s mean that the sellers take price in theirs side . This indicator can be used to determinate : ú - Trend ú - Changing Trend ú - Levels of overbought and oversold One of most important things about this indicator is that its behavior is close to the golden levels (1.62). Equilibrium (between the two opposites forces): It is when the indicator moves very close to value 1.62 That means that the price is moving in a horizontal wave or a changing side is expected. The imbalance between the two forces acting on the price is when their values and relative position are moving away from the equilibrium value (level 1.62) in both directions. Levels of overbought and oversold: • When the curves goes above the level 1.62 (or 2 if high volatility ), then the price is in overbought • When the curves passes below the level 1.0 then the price is in the oversold zone. Parameter : I recommend to save default parameter Period at 5 .