
Introduction
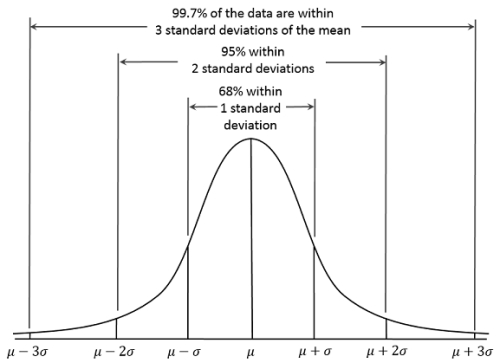
When trading, there are countless indicators and strategies people have discussed. However you are probably wondering, how many exactly? Generally speaking, most strategies fall in to two main categories. Trend trading strategies, and range trading strategies. The theory being that the price of an instrument is either moving, or it is not. If it is moving at a level that is significant to your time frame (minutes, days, months), then we can say that the price is trending. If it is still within 3 standard deviations (68–95–99.7 rule) after several iterations of your time frame, then it is safe to say that the price is ranging, as 3 standard deviations would encapsulate 99.7% of your data.
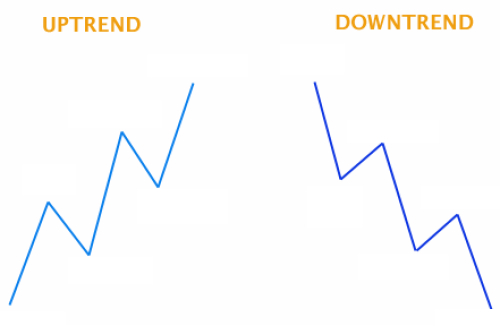
Trending Strategy
Indicator signals such as Ichimoku crossovers, or ADX can indicate if a trend is probable and can indicate the trend strength. Another sign of a trend would be the price crossing a pivot point calculated from the data of the past week, and just keep going.
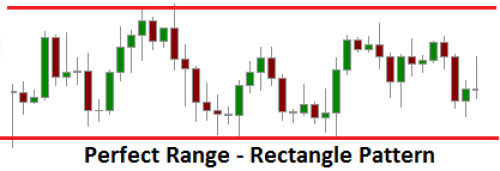
Ranging Strategy
When price is ranging, the price is less likely to cross the pivot points of the past week. A ranging price with low volatility can be treated as a standing wave. It goes up and down reliably, and is not going to break out. It may reach the pivot points but will reliably gravitate back towards the center line. Ranging price is where indicators such as RSI 30/70 and the Stochastic oscillator 80/20 rules come in to play to detect overbought and oversold levels.
Number of trades
The trading styles are further characterized by the number of orders they place. Swing trading involves placing a small number of large orders and exiting at peak profit. Scalping involves placing a large number of orders with small profits. These styles are applicable to both ranging and trending prices. Swing trading treats prices as waves on various time frames, entering and exiting on opposing peaks and troughs, whereas scalping observes prices on a candle by candle basis, and is ignorant of the overall structure observed on higher time frames.
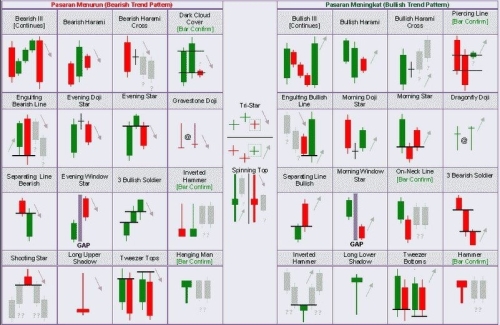
Candlestick Patterns
Steve Nison brought candlestick patterns to the west with his 1991 book, "Japanese Candlestick Charting Techniques". However the potency of candlestick patterns at predicting price movement rapidly dissipates 3 to 5 bars after the pattern has completed. This makes it unsuitable for predicting price movement at higher time frames.