
I come back with details about Ichimoku,because Likerty,challenge me :
 More ideea increase our tarders ability .
So,I will repeat some details about Ichimoku:
Guide to use Ichimoku Analysis in Forex
First of all, the Japanese word"Ichimoku" means "one glance", "Kinko" means "balance / equilibrium and "Hyo" means "chart", in
short Ichimoku Kinko means to see the equilibrium at a glance. Basically, the indicator is best used to define market trend, support and resistance and finally generate buy/sell signals.
Ichimoku Kinko Hyo consists of 5 lines and a"Kumo" or known as "cloud" as most people call it, they
are:
1. Tenkan-Sen(Conversion Line) -- (Highest High + Lowest Low)/2, for the past x periods
(Traditionally x=9)
2. Kijun-Sen (Base Line)-- (Highest High + Lowest Low)/2, for the past y periods (Traditionally y= 26)
3. Chikou Span (LaggingSpan) -- Today's closing price plotted y periods behind
4. Senkou Span A -- (Tenkan-Sen+ Kijun-Sen) / 2, plotted y periods ahead
5. Senkou Span B --(Highest High + Lowest Low) / 2, for the past z periods, plotted y periods
ahead (z = 52)
The space between the Senkou Span A andSenkou Span B is known as the Kumo or the cloud.
The Ichimoku Kinko Hyo works best on longer term time frames and is preferably to be used on daily and weekly charts.
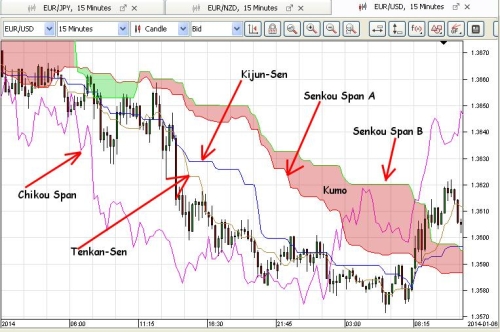
Every day I will post first this pictures to remember name of the lines.
Personaly I will use 15 Min,1 H and 4H .
Interpretation the indicators of Ichimoku
To start with, the Kumo (or most people call it cloud) is getting more popular among chartists to identify support and resistance area. When price is trading above the Kumo, the prevailing trend is said to be up and the Kumo will be treated as the support area whilst if price is below the Kumo, the trend is said to be down and the cloud will become resistance area instead.
If the price is below the Kumo (cloud), the lower line (i.e.the Senkou Span A) acts as the first resistance level, and the upper line (i.e.
Senkou Span B) becomes the second resistance level.
If the price is above the cloud, its upper line (i.e. the Senkou Span A) acts the first support level, and the lower line (i.e. the
Senkou Span B) becomes the second support level.
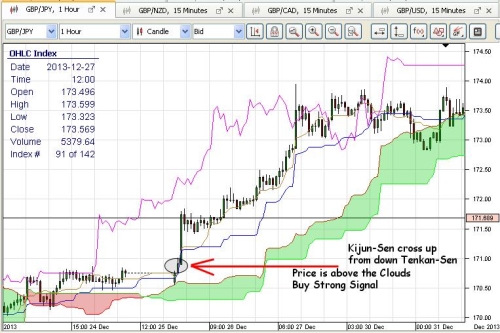
The applications of the 2 lines - Tenkan-Sen and Kijun-Sen are quite similar to moving average studies, buy and sell signals are generated when short-term line (Tenkan-Sen) crossover the longer-term line (Kijun-Sen).
A buy signal is generated when the Tenkan-Sen crosses above the Kijun-Sen from below. On the other hand, a sell signal is generated when the Tenkan-Sen crosses below the Kijun-Sen from above. However, one clear advantage of using Ichimoku Kinko over the moving average crossover is that the area where the Tenkan-Sen crosses the Kijun-Sen will dictate the relative strength of that buy/sell signal.
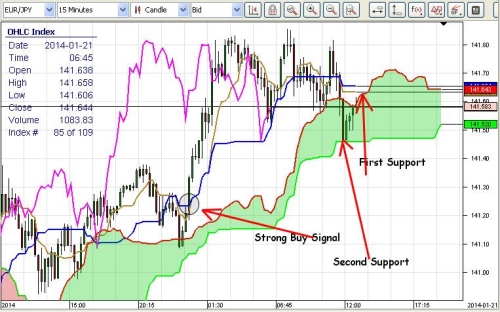
If a buy signal (i.e. the Tenkan-Sen crosses above theKijun-Sen from below) happens above the Kumo (or cloud), this would be
considered as a very strong buy signal as the cloud is representing support / resistance area.
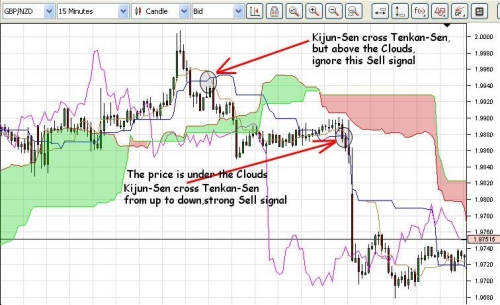
If the buy signal happens below the cloud, it will be viewed as a weak signal whilst if the sell signal occurs above the cloud, it will be treated as a weak signal also.
Similarly, if a sell signal (i.e. the Tenkan-Sen crosses below the Kijun-Sen from above) occurs below the cloud, this would be considered as a very strong sell signal. If the buy/sell signal occurs inside the Kumo (or cloud), this signal will be treated as normal.
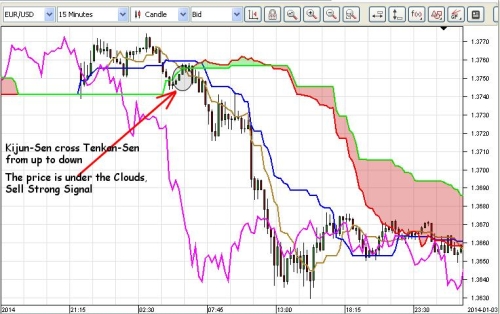
In next pictures we have one weak signal (must ignore it) and good one,Strong Sell Signal
If the buy signal happens below the cloud, it will be viewed as a weak signal whilst if the sell signal occurs above the cloud, it will be treated as a weak signal also.

And daily I will post Ichimoku analysis,but when I have time.Now I have a job and my money comes from this job.Anyway,I will post how often I can.
Good Luck .
 More ideea increase our tarders ability .
So,I will repeat some details about Ichimoku:
Guide to use Ichimoku Analysis in Forex
First of all, the Japanese word"Ichimoku" means "one glance", "Kinko" means "balance / equilibrium and "Hyo" means "chart", in
short Ichimoku Kinko means to see the equilibrium at a glance. Basically, the indicator is best used to define market trend, support and resistance and finally generate buy/sell signals.
Ichimoku Kinko Hyo consists of 5 lines and a"Kumo" or known as "cloud" as most people call it, they
are:
1. Tenkan-Sen(Conversion Line) -- (Highest High + Lowest Low)/2, for the past x periods
(Traditionally x=9)
2. Kijun-Sen (Base Line)-- (Highest High + Lowest Low)/2, for the past y periods (Traditionally y= 26)
3. Chikou Span (LaggingSpan) -- Today's closing price plotted y periods behind
4. Senkou Span A -- (Tenkan-Sen+ Kijun-Sen) / 2, plotted y periods ahead
5. Senkou Span B --(Highest High + Lowest Low) / 2, for the past z periods, plotted y periods
ahead (z = 52)
The space between the Senkou Span A andSenkou Span B is known as the Kumo or the cloud.
The Ichimoku Kinko Hyo works best on longer term time frames and is preferably to be used on daily and weekly charts.

Every day I will post first this pictures to remember name of the lines.
Personaly I will use 15 Min,1 H and 4H .
Interpretation the indicators of Ichimoku
To start with, the Kumo (or most people call it cloud) is getting more popular among chartists to identify support and resistance area. When price is trading above the Kumo, the prevailing trend is said to be up and the Kumo will be treated as the support area whilst if price is below the Kumo, the trend is said to be down and the cloud will become resistance area instead.
If the price is below the Kumo (cloud), the lower line (i.e.the Senkou Span A) acts as the first resistance level, and the upper line (i.e.
Senkou Span B) becomes the second resistance level.
If the price is above the cloud, its upper line (i.e. the Senkou Span A) acts the first support level, and the lower line (i.e. the
Senkou Span B) becomes the second support level.

The applications of the 2 lines - Tenkan-Sen and Kijun-Sen are quite similar to moving average studies, buy and sell signals are generated when short-term line (Tenkan-Sen) crossover the longer-term line (Kijun-Sen).
A buy signal is generated when the Tenkan-Sen crosses above the Kijun-Sen from below. On the other hand, a sell signal is generated when the Tenkan-Sen crosses below the Kijun-Sen from above. However, one clear advantage of using Ichimoku Kinko over the moving average crossover is that the area where the Tenkan-Sen crosses the Kijun-Sen will dictate the relative strength of that buy/sell signal.
If a buy signal (i.e. the Tenkan-Sen crosses above theKijun-Sen from below) happens above the Kumo (or cloud), this would be
considered as a very strong buy signal as the cloud is representing support / resistance area.

If the buy signal happens below the cloud, it will be viewed as a weak signal whilst if the sell signal occurs above the cloud, it will be treated as a weak signal also.
Similarly, if a sell signal (i.e. the Tenkan-Sen crosses below the Kijun-Sen from above) occurs below the cloud, this would be considered as a very strong sell signal. If the buy/sell signal occurs inside the Kumo (or cloud), this signal will be treated as normal.

In next pictures we have one weak signal (must ignore it) and good one,Strong Sell Signal

If the buy signal happens below the cloud, it will be viewed as a weak signal whilst if the sell signal occurs above the cloud, it will be treated as a weak signal also.

And daily I will post Ichimoku analysis,but when I have time.Now I have a job and my money comes from this job.Anyway,I will post how often I can.
Good Luck .